Missed Team ’24? Catch up on announcements here.
×Community resources
Community resources
Community resources
T-shooting LogicMonitor integration, no alerts created
I've followed the articles on how to set this up and I have both the OG integration and the LM custom http delivery.
On the LM side I can see the Opsgenie payload go out.
On the OG side I can see in the logs two entries: Processing incoming data, and Started to execute action: Create Alert
However I am unable to find the Alert itself. Under the Integration settings I am using the default Actions. There are no Alert or Notification policies, and no Incident Rules either...
Every article or document I can find suggests that it should 'just work'. So here I am, begging for help :)
1 answer
1 accepted
Hi @Ben Hart ,
At the bottom of our LogicMonitor documentation includes a Troubleshooting section that I would suggest reviewing:
Troubleshooting test alerts
These informational alerts denote that incoming data is for testing purposes only. Since testing data could differ from the expected data, we create an alert without running the integration flow.
While processing a LogicMonitor request, we check whether it is a test request. If it is, we interrupt the integration flow (which populates the dynamic fields, etc) and create an alert request with desired parameters. If the integration field is null during processing, it's set to DefaultAPI integration (which can't be removed or guaranteed to exist). In this case, it becomes an alert created by the default API.
We would also suggest reviewing this Community Article: Integration not creating Opsgenie alert
Specifically reviewing the Logs tab within your Opsgenie. There you can check whether or not Opsgenie is receiving the requests from LM. If Opsgenie is receiving the requests, the test alerts could be created through the Default API integration as mentioned above instead of the LM integration.
This is how Opsgenie handles test alerts for some integrations - so the connection can be tested with the actual integration/notification processing taken out of the equation, but ensures there is a connection with Opsgenie. Real alerts created by the integration moving forward should trigger through the integration, and notify as expected / send to a team.
If no requests are being received by Opsgenie, then it's most likely a slight misconfiguration on the LM side that is preventing requests from sending to Opsgenie. Had Opsgenie received the requests, they would be found in the Logs tab.
Thanks Nick, I did see that but it's not clear at all on what the process to create this test alert is. The document displays a sample JSON payload then vaguely references it below there.. Is the article trying to explain that if we send that sample payload to Opsgenie that it will create a test alert bypassing the integration?
Also the Logs.. yeah I mentioned that in my question. I am using them but they are also not very clear.. as far as logs go. My request comes in, and the default integration 'Create Alert' action is "started to execute". That's it! No completed, no error, nothing else is mentioned.
Should there be another log entry regarding the alert created or the action was successful?
You must be a registered user to add a comment. If you've already registered, sign in. Otherwise, register and sign in.
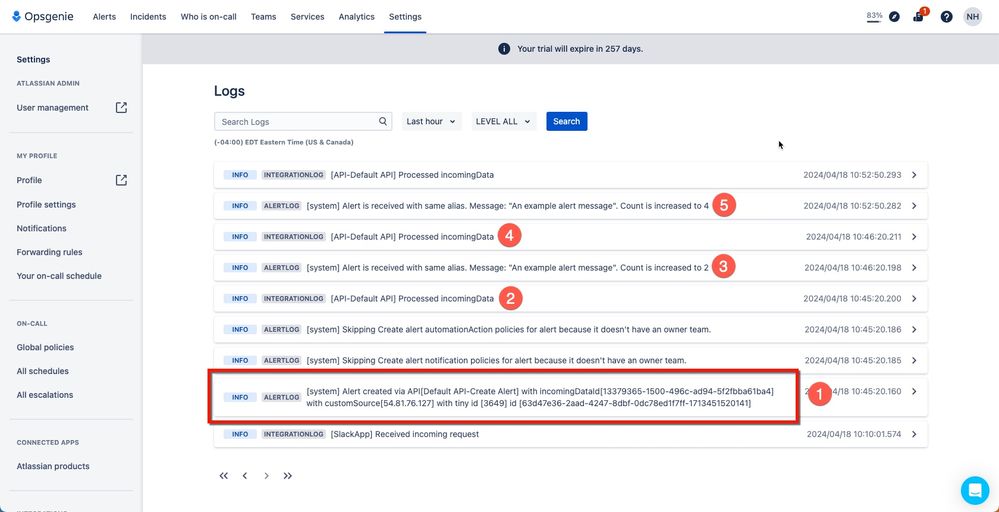
If an alert was created, there would be a log such as the one below (1) that shows the alerts tiny ID and "Alert created":
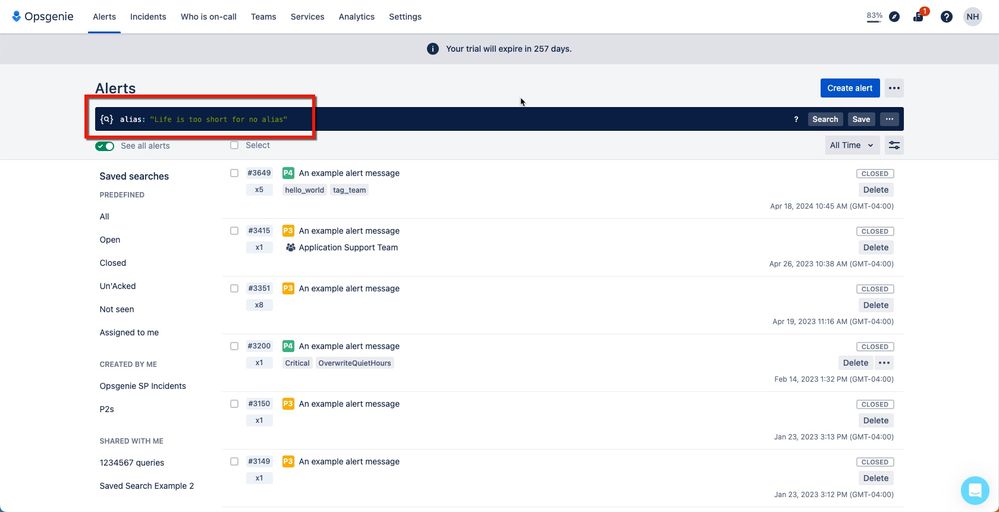
Notice logs 2-5 - those are for deduplicated alerts/requests that increase the count of an already existing open alert. Maybe your request is being received and rolling into another alert. I would run a query on the alert's alias to see if that's the case and if currently exists in your Opsgenie:
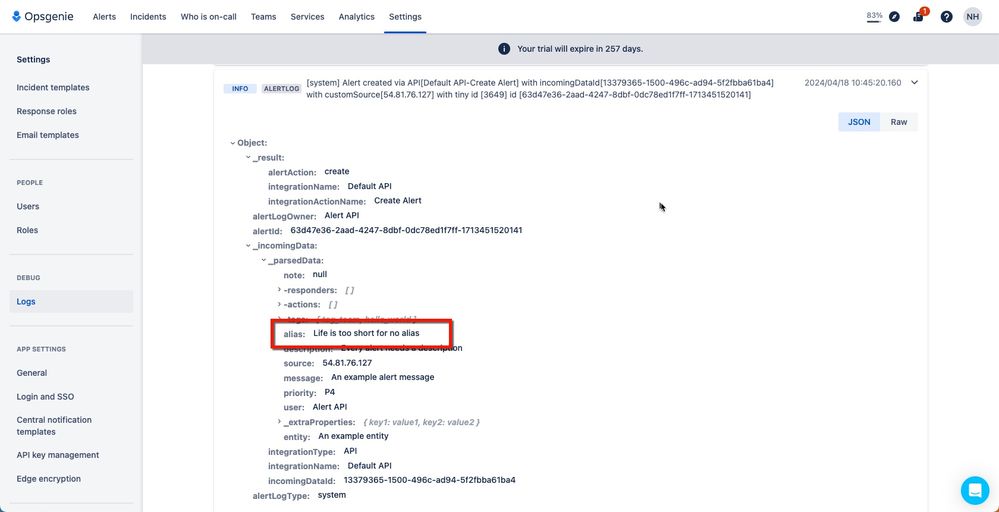
Otherwise I would review the logs a bit further to see if the payload received gives any more insight into what might be happening with the request.
If all else fails, try reaching out to Opsgenie support for additional assistance so they can review your account, or feel free to share any screenshots here.
You must be a registered user to add a comment. If you've already registered, sign in. Otherwise, register and sign in.
Continued thanks Nick. Yeah so I was getting those log events for 'alert created' however there actually was no alert created.. until I removed a custom token from the form data on the LM side.
Originally I had pasted in the payload directly from the Opsgenie integration page. Noticing no `alert_url` and since that is a valid LM token, I added it. When no alerts were created I started looking at the logs on both sides. Lm was sending the custom alert delivery correctly but missing from the display of the "full view" payload was most of the tokens in the form data supplied by Opsgenie, like over half were not in the logged data. However those missing did actually make it into OG (except for alert_url).
Then checking the OG side, it's own logs were, confusing at best. So that's when I decided to post here. I do have a support case open with LM to figure out if the lack of display is a known issue.
After removing `alert_url` I am not creating alerts in OG, and after setting up the HSM integration.. incidents in Jira. So that's good.
The next hurdle I have discovered involves changes on the JSM side not being communicated to LogicMonitor, for which I figured I'd create a new thread here for.
You must be a registered user to add a comment. If you've already registered, sign in. Otherwise, register and sign in.

Was this helpful?
Thanks!
DEPLOYMENT TYPE
CLOUDAtlassian Community Events
- FAQ
- Community Guidelines
- About
- Privacy policy
- Notice at Collection
- Terms of use
- © 2024 Atlassian


You must be a registered user to add a comment. If you've already registered, sign in. Otherwise, register and sign in.